Vermicompost as a Sustainable Alternative to Peat Moss in Soilless Strawberry Cultivation
Authors
Mahsa Azizi Yeganeh,
Ali Asghar Shahabi,
Ali Ebadi,
Vahid Abdossi
Isfahan Agricultural and Natural Resources Research Center, Iran,
University of Kurdistan, Iran
Department of Horticultural Sciences, University of Tehran, Iran
Introduction
Objective
To evaluate the effects of replacing peat moss with vermicompost at different ratios on strawberry growth, yield, and fruit quality across two cultivars—Selva and Camarosa— under soilless hydroponic systems.
Methodology
- Design: Split-plot randomized complete block design (3 replications)
Main treatment: Four substrate mixtures
- S1: 50% Perlite + 50% Peat Moss
S2: 70% Perlite + 30% Peat Moss
S3: 50% Perlite + 50% Vermicompost
S4: 70% Perlite + 30% Vermicompost
Sub-treatment: Two cultivars (Selva, Camarosa)
- Measured parameters: Yield, leaf number, inflorescences, shoot/root biomass, chlorophyll index, vitamin C, total soluble solids (TSS).
- Conditions: Controlled hydroponic greenhouse, 18–25 °C, 60% RH.
Results
- Yield: Highest yield in Camarosa (50:50 perlite:peat moss) and Selva (70:30 perlite:vermicompost); no significant difference between them.
- Root growth: Selva in 50:50 perlite:vermicompost showed highest root fresh and dry weight.
- Fruit quality: Camarosa in 50:50 perlite:vermicompost had highest vitamin C (71.5 mg/l); Selva in 50:50 perlite:vermicompost showed highest TSS (6.2 °Brix).
- Chlorophyll index: Peat-based substrates yielded higher chlorophyll values.
- Salinity tolerance: Selva cultivar tolerated vermicompost salinity better.
Analysis
Vermicompost improved nutrient balance and microbial activity, enhancing quality parameters without compromising yield.
While peat moss promoted vegetative growth, vermicompost fostered stronger root systems and better fruit chemistry. The 30-50% vermicompost mixes achieved results comparable to or better than peat-based controls, demonstrating its potential as a sustainable local substitute.
| Parameter | Best Performing Mix | Outcome |
|---|---|---|
| Yield | 70% Perlite : 30% Vermicompost | Equal to peat moss control |
| Vitamin C | 50% Vermicompost : 50% Perlite | Fruit antioxidant content |
| TSS | 50% Vermicompost : 50% Perlite | Fruit sweetness |
| Root Mass | 50% Vermicompost : 50% Perlite | T Root dry weight |
| Cost & Sustainability | Local input | Imported substrate dependence |
Conclusion
Expriment results highlighted the importance of considering both main and sub-treatments in agricultural research, as they interacted to influence various
growth and yield parameters. 50% vermicompost treatment combined with perlite had a positive impact on plant growth and in quality index such as
vitamin C content and TSS was highest. while the choice of cultivar affected different aspects of plant development. Selva cultivar was known to be more
tolerant to salinity caused by vermicompost. Vermicompost is local and more economical, also salt resistant cultivars are recommended in a controlled
(30%) amount of vermicompost.
Comparative Nutrient Profile of Commercial Vermicompost Brands
| Sample | Basic Parameters | Macro Nutrients | Micro Nutrients | |||||||||||||
|---|---|---|---|---|---|---|---|---|---|---|---|---|---|---|---|---|
| pH | EC (mmhos/cm) | Moisture (%) | Ash (%) | Org. Carbon (%) | Org. Matter (%) | C/N Ratio | N (%) | P2O5 (%) | K2O (%) | Ca (%) | Mg (%) | Fe (%) | Mn (ppm) | Zn (ppm) | Cu (ppm) | |
| A | 7.56 | 5.61 | 23.5 | 66.7 | 7.43 | 12.81 | 10.51 | 0.5 | 1.26 | 0.89 | 3.01 | 0.43 | 0.39 | 175.84 | 61.14 | 18.94 |
| B | 9.76 | 10.77 | 4.97 | 84.13 | 6.65 | 11.47 | 21.72 | 0.29 | 0.38 | 9.88 | 2.52 | 1 | 0.78 | 141.47 | 18.65 | 315.61 |
| C | 7.27 | 3.36 | 43.37 | 35.11 | 22.04 | 38 | 9.97 | 1.25 | 1.38 | 1.66 | 5.97 | 0.86 | 0.32 | 214.45 | 135.17 | 24.69 |
| D | 8.17 | 6.06 | 5.98 | 63.54 | 18.8 | 32.42 | 12.95 | 1.37 | 7.06 | 0.63 | 6.87 | 0.83 | 0.96 | 396.64 | 175.13 | 72.26 |
| Nama Green | 6.7 | 3.91 | 29.74 | 44.52 | 21.25 | 36.64 | 12.28 | 1.22 | 1.22 | 0.51 | 3.31 | 0.58 | 0.78 | 372.69 | 125.28 | 34.54 |
Sample A
Sample B
Sample C
Sample D
Nama Green
Quality Specification of Nama Green Vermi Fertilizer
| Nutrients | Unit | Value Range |
|---|---|---|
| pH | – | 6.7 – 8 |
| EC | mmhos/cm | 3.50 – 4.50 |
| Organic Matter (dry) | % | 35-45% |
| Organic Carbon (dry) | % | 20-25% |
| C/N Ratio | – | 12 – 18 |
| Nitrogen (N) | % | 1 – 1.7 |
| Phosphorus (P₂O₅) | % | 1 – 1.5 |
| Potassium (K₂O) | % | 0.4 – 0.70 |
| Ca | % | 3.31 |
| Mg | % | 0.58 |
| Fe | % | 0.78 |
| Mn | ppm | 372.69 |
| Zn | ppm | 125.28 |
| Cu | ppm | 34.54 |
Long-term Yield Comparison: Organic vs Conventional Farming
Organic Farming (Yield)
Conventional Farming (Yield)
Yield (Relative Units)
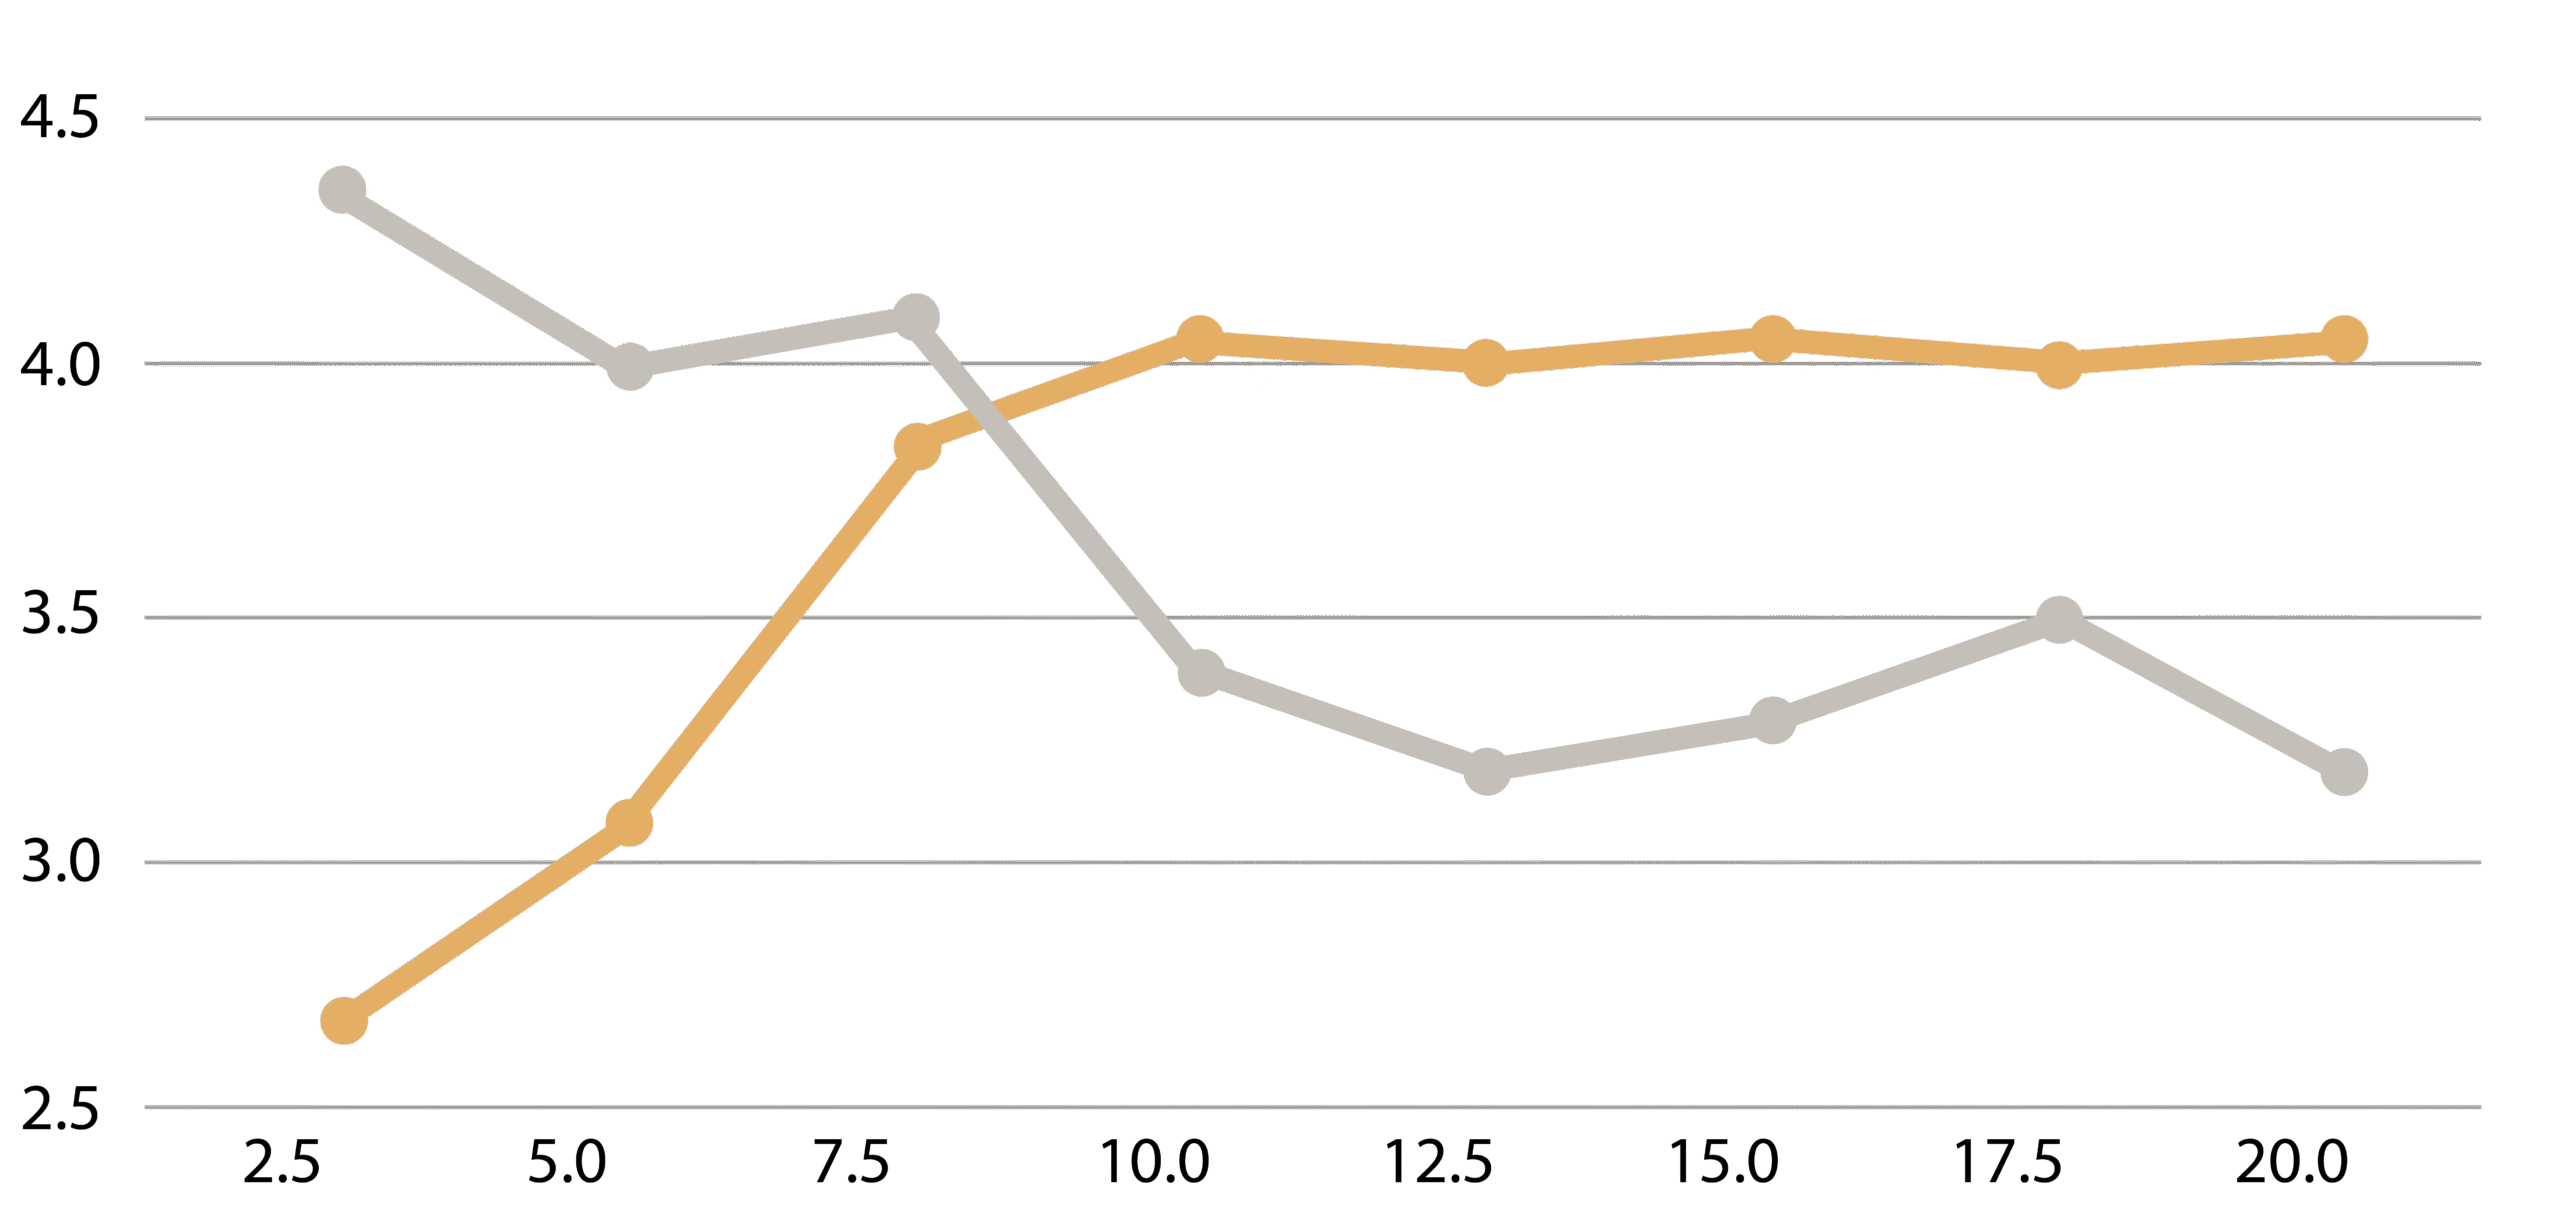
Years
General Test Bed Layout for Testing Nama Green Vermi Fertilizer
| Plot Name | Plot Size (Acre) | Input Type | Input Amount (Kg) |
|---|---|---|---|
| Control | 0.25 | No input | 0 |
| Current Input | 0.25 | Conventional NPK Fertilizers (Urea, DAP, MOP) | 40 kg Urea, 15 kg DAP, 15 kg MOP |
| Nama Green Only | 0.25 | Vermi Fertilizer | 300 kg |
| Nama Green + Curren Input | 0.25 | Vermi Fertilizer + Conventional NPK | 210 kg Nama Green, 12kg Urea, 3 kg DAP , 3 kg MOP |